
Analytics in Today’s World
Businesses today are using analytics to increase efficiency, revenue and bring informed transformation in their enterprise by leveraging data. Through the process of Business Analytics, enterprises are making significant improvements by gathering data and analyzing them. Data analytics plays a key role in this digital world for creating new business frameworks and identify new and better opportunities. Irrespective of the size of a business, AI, data, and analytics services together enables them to deliver value to their customers by providing them intuitive and agile processes.
The analytics tools that are used by businesses today are quite advanced. They have the capability of executing analytics processes right from data collection to report preparation. These reports will enable predictive analysis based on which businesses can create strategies to manage capital loss and risks.
Benefits
Enterprises must understand the important role analytics play for their enterprise. Following are some of the benefits that enterprise can avail:
Data Leverage: Any feedback or opinions presented by customers on social platforms or business websites is a form of data. Using this, enterprises can have a better understanding of customer’s requirements.
Optimize Operation: Using Analytics, businesses can optimize their business operation. From understanding demand surges to maintaining supply enterprises can offer sales, discount and price products based on their shortage or peak.
Visualize Data: Visualization of the business data using analytics makes it easy to design reports and set goals. This also allows better exploring of the information, analysis them, and create an action plan.
Strategy Forecast: Analytics enables businesses to get an insight into their customer’s behavior for a certain period. By making an observation of these repetitive behaviors, enterprises can forecast strategies that will fit with their client’s needs.
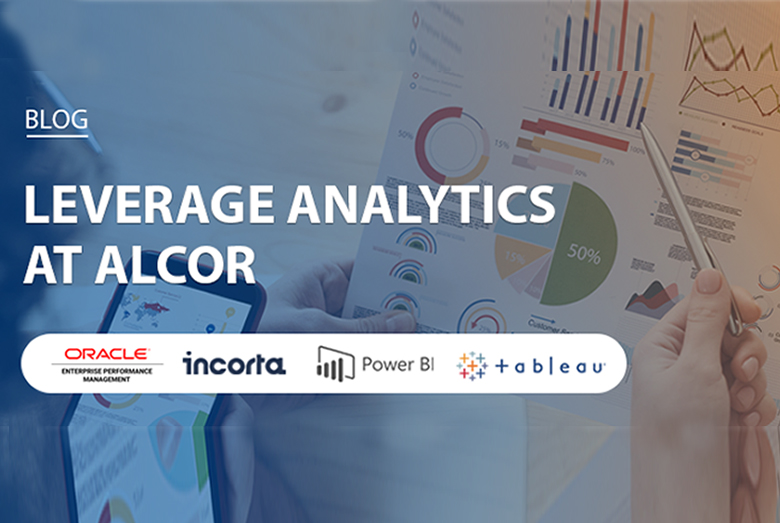
Alcor’s Capabilities
With data growing faster than ever, businesses are looking for better ways to analyze business data and drive informed and quicker decisions. The certified functional and domain cloud analytics experts in Alcor’s team hold expertise in delivering agility and analytics solutions with the following tools:
Oracle EPM:
Oracle Enterprise Performance Management (EPM) Cloud is a highly configurable business process—that includes industry best practices, features, and usability—to align with the customer’s strategy with execution. Oracle EPM is an analytics platform that has a high capability of data modeling which provides businesses with reliable and standardized data reporting. It also offers agility to perform data preparation, data integration, and reporting.
Capability:
Oracle EPM Cloud assists enterprises to adapt to the changing compliance and business requirements by offering faster delivery, improved controls, and accurate insights to the stakeholders of the enterprises. With this platform, businesses of all sizes can manage their data flexibly. This enables data management and agile business transformation.
Features:
Tableau
Tableau is a leading analytics tool that can take in any type of raw data and transform them into an understandable format with speed and ease. The visualization created by this tool is very easy and therefore it enables even a non-technical individual to customize their dashboard. This helps in building data culture in enterprises. The intuitive interface of Tableau is capable of complete high-end analytics projects rapidly.
Capabilities:
Tableau allows segmentation with simple drag and drop. From creating product categories to projecting sales over a financial year, everything can be featured on the dashboard. In addition, Tableau promotes intuitive flow as well as flexible and rapid cohort analysis. The flexibility of Tableau’s front-end can be leveraged for input capabilities, modifying calculations, and test various scenarios. The platform has a strong calculation language which enables augmenting analysis and manipulation of complex data.
Features:
Incorta
For businesses looking for agility with less roadblock, innovation, and insight, data analysis technology Incorta is the answer for them. This platform offers data experience while giving its users the means to find, analyze, enrich and act on their business data with simplicity and speed. It allows users to have a deeper and detailed understanding of their business thus arming them with the knowledge to make accurate decisions.
Capabilities:
Incorta consolidates analytics function and essential data together for data storage, data acquisition, data visualization, and data exploration. In addition, users can connect with data sources and build a data store that is compact versatile, and caters to several workloads. By unifying data pipelines, data analytics and data science users are able to process huge volumes of data. In addition, Incorta offers personalized dashboards and consolidated connections to several data sources.
Features:
Power BI
Power BI is a data analysis service that is cloud-based. It is an assemblage of connectors and applications that work together to transform unrelated data sources into visually immersive, coherent, and interactive insight Irrespective of the data present on the cloud, data warehouse, or a spreadsheet, Power BI allows its users to connect with their data source and extract information assets.
Capabilities:
Power BI makes it possible for users to see all their data on a single platform by creating an analytical environment for managing data and sharing reports. Their live dashboard provides performance indicators based on the enterprise’s data both locally and in the cloud. This largely benefits businesses as they can get an understanding of the progress of their business, its profit- and loss-making areas. Based on this information, businesses can make strategies.
Features:
Conclusion
Irrespective of the type or the size of the industry, everyone is leveraging data and data technologies to improve the functionality of their business create solutions for their customers that will impact them in every conceivable manner. The science of data analytics is being used across various industry verticals including Agriculture, Retail, Banking, Government and Public sector, and more. Data Analytics provides enterprises the insight for their performance improvement. It adds to their knowledge about the target audience they are catering to, personalize their content, develop strategies, assess their ad campaigns, and their budget. With the use of Analytics tools, enterprises are unleashing the full potential of their complex data and gain the ability to store, model, manage, and maintain data at scale.